Introduction
In this blog, I am going to be explaining the difference between descriptive analytics and a dashboard representation of data, the relationship between the two of them and I would be explaining the importance and how they operate and lastly, why do we need them in the organization.
https://www.dezyre.com/article/types-of-analytics-descriptive-predictive-prescriptive-analytics/209
Definition
According to dezyre descriptive analytics is defined as a preliminary stage of data processing that creates a summary of past events data that produces useful information and able to prepare the data for past events analysis. Diagnostic analytics is a deeper look at data to attempt to understand the causes of events and behaviors.
Concept of descriptive analytics
It is all about providing information about the pat of what happened . for example an increase in Instagram or twitter followers after a particular post. Diagnostic analytics is a deeper look at data to attempt to understand the causes of events and behaviors.
https://whatis.techtarget.com/definition/descriptive-analytics
The important of Descriptive analytics
Descriptive analytics helps with the performance analysis for the managers so they can make informed strategic business decisions based on past event data, and is one of the most basic pieces of business intelligence a company will use. Although can be industry specific such as the seasonal variation in shipment completion times analytics use broadly accepted measures common throughout the finance industry.
Generally speaking, the larger and more complex a company is, the more descriptive analytics it will use to measure its performance. Return on invested capital is a descriptive analytic created by taking three data points net income, dividends, and total capital and turning those data points into an easy to understand percentage that can be used to compare one company’s performance to others.
https://www.investopedia.com/terms/d/descriptive-analytics.asp
- Descriptive analytics is the process of resolving past data events to better understand the changes that have occurred in business.
- Using a range of historic data and benchmarking, decision makers obtain a holistic view of performance and trends on which to base business strategy.
- It can help to identify the areas of strength and weakness in a company.
Fast Fact
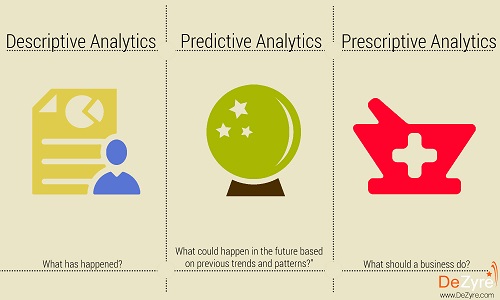
Descriptive analytics brings about the question about what happened information or concerning the company’s operations, whole diagnostic analytics provides the and to find out why did it happen information, and to predict the future about what could happen.
There are three pillars of stable eCommerce business development which are descriptive, predictive, and prescriptive analytics data. You might not use these particular definitions, but you certainly already use at least two types of this data to improve your website efficiency. In a nutshell, descriptive analytics it has been designed to analyse past event data, predictive analytics to forecast future performance, and prescriptive to develop a strategy for the predicted scenario.
https://www.investopedia.com/terms/d/descriptive-analytics.asp


https://www.ibm.com/blogs/business-analytics/descriptive-analytics-101-what-happened/
Example of descriptive analytics
Usually, a common example of descriptive analytics is organization reports that provide a historical review of the company’s operations, the stakeholders, financials, sales, and customers and other methods are observations.
https://www.dataversity.net/fundamentals-descriptive-analytics/

https://www.ibm.com/blogs/business-analytics/descriptive-analytics-101-what-happened/

https://towardsdatascience.com/a-beginners-guide-to-business-dashboards-981a8192a967
Definition
A data dashboard
“Data dashboard is an information management tool that visually tracks, analyzes and displays key performance indicators, metrics, and key data points to monitor the health of a business, department or specific process”. They are customizable to meet the specific needs of a department and company. Behind the scenes, what dashboard does it connects to your files, attachments, services and API’s, but on the surface displays all this data in the form of tables, line charts,and bar charts.
It is very important to have a data dashboard because is the most efficient way to track multiple data sources because it provides a central location for businesses to monitor and analyze performance. Real time monitoring reduces the hours of analyzing and along lines of communication that previously challenged businesses.
https://www.klipfolio.com/resources/articles/what-is-data-dashboard
In most cases, descriptive statistics summarize data from a single source. Dashboards provide an at‐a‐glance view of Key Performance Indicators (KPIs) relevant to a particular objective or business process (e.g., sales, marketing, human resources or production).

The way data dashboards work
It is very important for the Dashboard users to know that is dependent on the role it plays within an organization. Everyone uses data dashboards in a different way. Not all business dashboards serve the same purpose, which is why it’s important users understand what KPIs to track and why.
- The kinds of business questions do dashboards answer
- The type of data is tracked on dashboards
- How do the dashboards interact
Dashboards are fueled by Business Questions
The most common approach to designing a business dashboard is to build it using a question answer format. The best data dashboards answer important questions about your business. Unlike advanced business intelligence tools, dashboards are designed for quick analysis and informational awareness.
Dashboards can focus on presenting operational and analytical data
The business questions a dashboard answer depends on industry, department, process, and position. Analytical dashboards are typically designed to help decision makers, executives and senior leaders, establish targets, set goals and understand what and why something happened with the same information they can use to implement appropriate changes. An analytical dashboard does this based on insights from data collected over a period of time determined by the user (i.e. last month, quarter or year).
Dashboards present interactive data visualizations
Data is visualized on a dashboard as tables, line charts, bar charts, and gauges so that users can track the health of their business against benchmarks and goals. Data dashboards surface the necessary data to understand, monitor and improve your business through visual representations. Depending on how you decide to design your dashboard, even straightforward numerical data can be visually informative by utilizing intuitive symbols, such as a red triangle facing downward to indicate a drop in revenue or a green triangle facing up to indicate an increase in website traffic.
Conclusion
I was amazed to learn that descriptive analytics is part of providing information about the past things that happened, for example, Twitter uses it for followers for some post is really amazing. and Dashboard I only knew car dashboard but during my reading on this topic, I discover that this type helps to truck business and see how business performs I will recommend it for any organisation to use it.
